Multiple Choice
Solve the problem.
-The graph shows the average cost of a barrel of crude oil for the years 1981 to 1990 in constant 1996 dollars. Find the approximate average change in price from 1981 to 1985.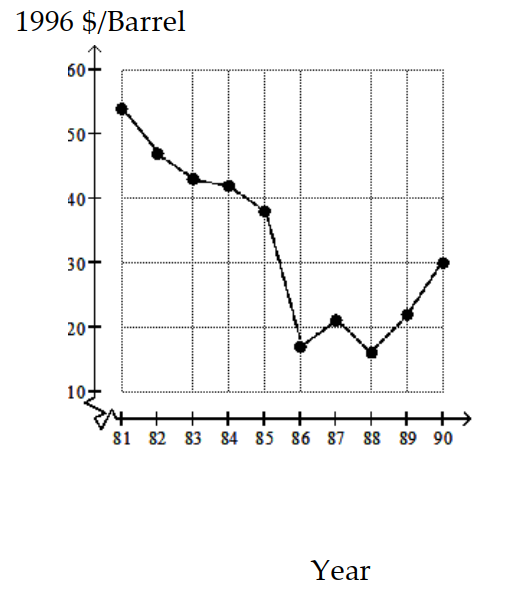
A) About year
B) About - year
C) About year
D) About year
Correct Answer:

Verified
Correct Answer:
Verified
Q188: Solve the problem.<br>-The power <span
Q189: Use the quotient rule to find
Q190: Solve the problem.<br>-The cost of manufacturing
Q191: Use the properties of limits to
Q192: Solve the problem.<br>- <span class="ql-formula" data-value="\$
Q194: Solve the problem.<br>-A voltage source of
Q195: Solve the problem.<br>-Assume the total revenue
Q196: Find the average rate of change
Q197: Find the derivative of the function.<br>-
Q198: Find the following.<br>- <span class="ql-formula" data-value="f^{\prime}(16)"><span