Multiple Choice
Which one of the following histograms depicts the numbers in Problems 13 - 16 ?
A) 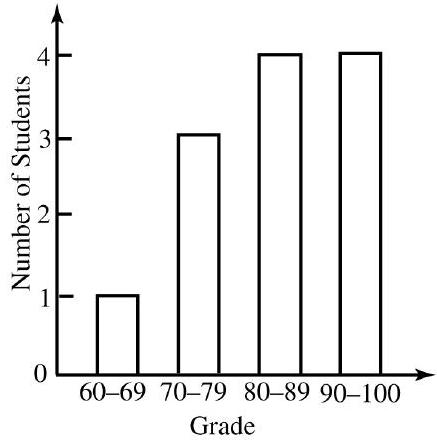
B) 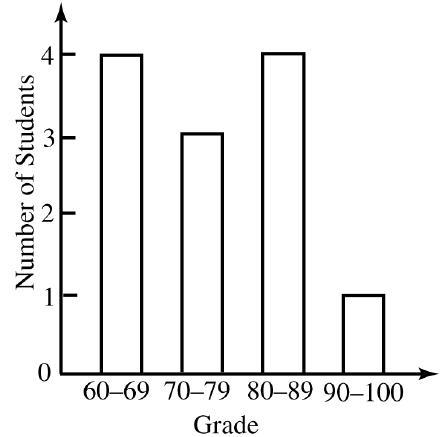
C) 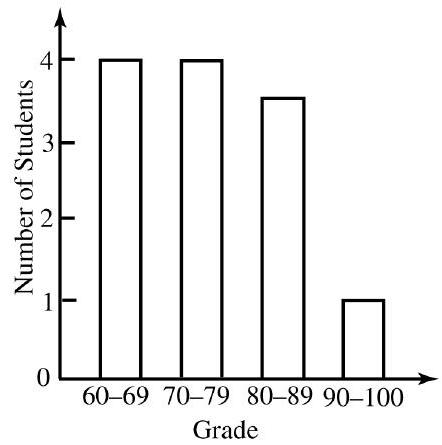
D) 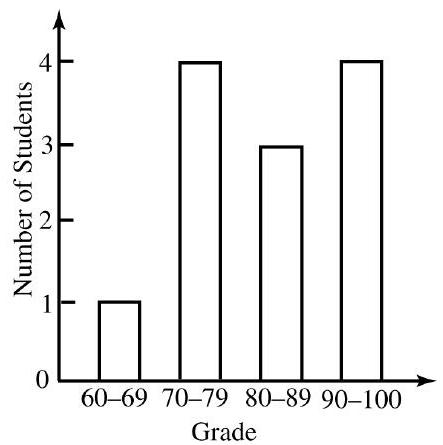
Correct Answer:

Verified
Correct Answer:
Verified
Related Questions
Q90: The circle graph shows the operating
Q91: During one semester, students at a
Q92: Here are the grades for students
Q93: Find the median for each list of
Q94: Find the weighted mean for each of
Q96: Use the numbers found in Problems 13
Q97: The circle graph shows the operating
Q98: Find the mean for each list
Q99: Here are the grades for students in
Q100: Here are the grades for students in