Multiple Choice
Which one of the following histograms depicts the numbers in Problems 13 - 16 ?
A) 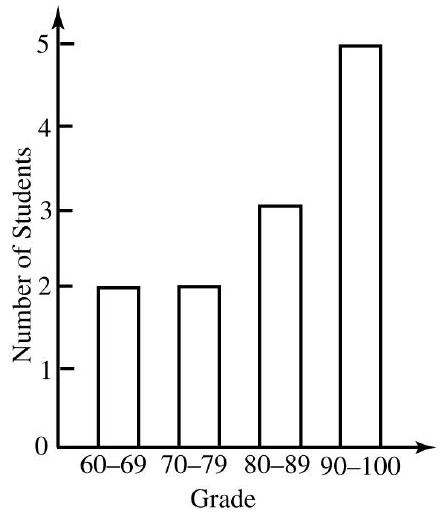
B) 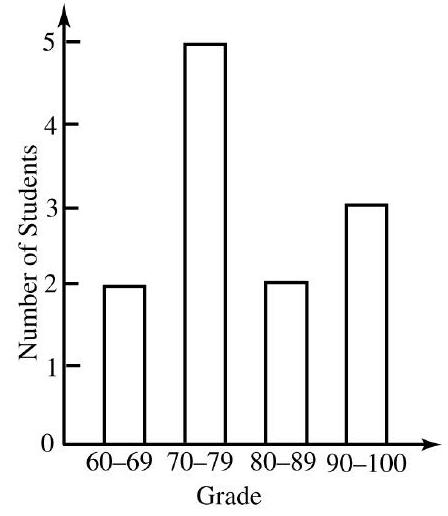
C) 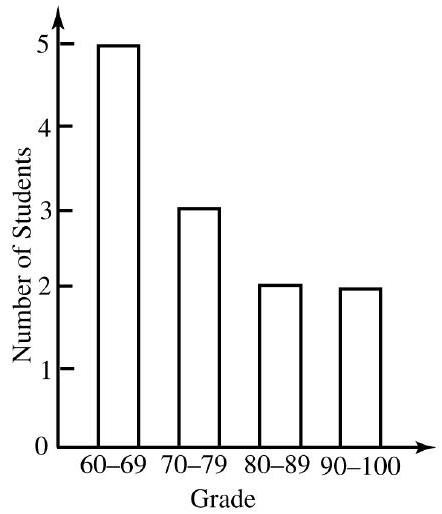
D) 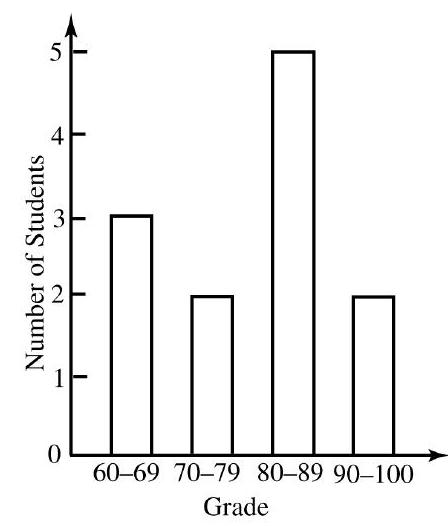
Correct Answer:

Verified
Correct Answer:
Verified
Related Questions
Q107: The circle graph shows the operating
Q108: The circle graph shows the operating budget
Q109: The circle graph shows the operating budget
Q110: Find the mean for each list of
Q111: Explain in your own words the procedure
Q113: The circle graph shows the operating
Q114: The circle graph shows the operating budget
Q115: Draw a circle graph using the information
Q116: The following graph lists the number of
Q117: During one semester, students at a