Short Answer
In the tables below, population (not sample) means are given for the cells. In each case, compute the marginal means and indicate whether the table shows (1) a main row effect, (2) a main column effect, (3) an interaction effect. Remember: population values do not show the effects of sampling variation. 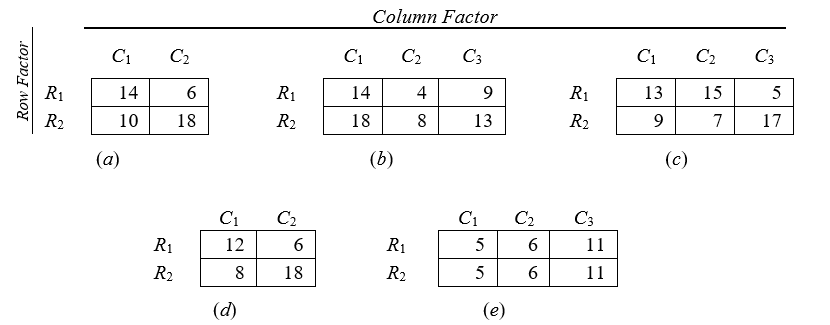
Correct Answer:

Verified
(a) row, interaction...View Answer
Unlock this answer now
Get Access to more Verified Answers free of charge
Correct Answer:
Verified
View Answer
Unlock this answer now
Get Access to more Verified Answers free of charge
Q20: Suppose, in a two-way analysis of variance,
Q21: In two-factor analysis of variance, the denominator
Q22: Two approaches, S (structured) and U (unstructured),
Q23: Suppose, in a two-way analysis of variance,
Q24: We are studying the effect of two
Q25: In general, the number of degrees of
Q26: A graph is made of the cell
Q27: Using an equal number of cases per
Q28: (a) -(e)Draw a graph of the cell
Q30: In general, the number of degrees of