Essay
Use the following
Data were collected on the age (in years) and price (in thousands of dollars) of a random sample of 25 used Hyundai Elantras. A scatterplot of the data (with regression line) and computer output from a regression analysis are provided.
Use three decimal places when reporting the results from any calculations, unless otherwise specified.
The regression equation is Price = 15.3 - 1.71 Age

S = 1.37179 R-Sq = 88.9% R-Sq(adj) = 88.4%
Predicted Values for New Observations

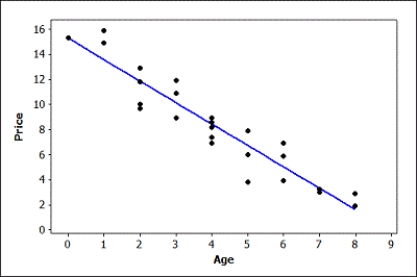
-Use the scatterplot to determine whether we should have any serious concerns about the conditions being met for using a linear model with these data. Explain briefly.
Correct Answer:

Verified
There are no concern...View Answer
Unlock this answer now
Get Access to more Verified Answers free of charge
Correct Answer:
Verified
View Answer
Unlock this answer now
Get Access to more Verified Answers free of charge
Q105: Use the following <br>A quantitatively savvy, young
Q106: Use the following<br>In recent years, fast food
Q107: Use the following <br>In recent years, fast
Q108: Use the following<br>Students in a small statistics
Q109: Use the following <br>In recent years, fast
Q111: Use the following <br>Computer output from a
Q112: Use the following <br>Data were collected on
Q113: In a random sample of 41 students,
Q114: Use the following <br>In recent years, fast
Q115: Use the following<br>Students in a small statistics