Multiple Choice
Use the following
A dotplot and the summary statistics for a sample are provided. In each case, indicate whether or not it is appropriate to use the t-distribution.
-n = 100;  = 9.93; s = 9.247
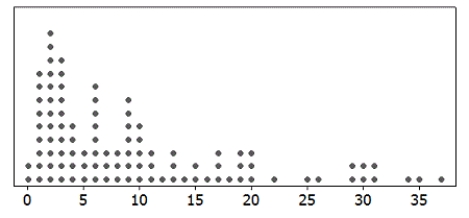
A) Appropriate
B) Not Appropriate
Correct Answer:

Verified
Correct Answer:
Verified
Related Questions
Q31: Use the following <br>For each of the
Q32: Use the following <br>Consider taking samples of
Q33: Use the following <br>In 2005, the average
Q34: Use the following <br>A certain species of
Q35: Use the following <br>"Black Friday,"<br>which occurs annually
Q37: Use the following <br>In an August 2012
Q38: Use the following <br>For each of the
Q39: Use the following<br>November 6, 2012 was election
Q40: Use the following<br>In a survey conducted by
Q41: Use the following <br>In an August 2012