Essay
Use the following
November 6, 2012 was election day. Many of the major television networks aired coverage of the incoming election results during the primetime hours. The provided boxplot displays the amount of time (in minutes) spent watching election coverage for a random sample of 25 U.S. adults. In this sample, the average time spent watching election coverage was 80.44 minutes with standard deviation of 43.99 minutes.
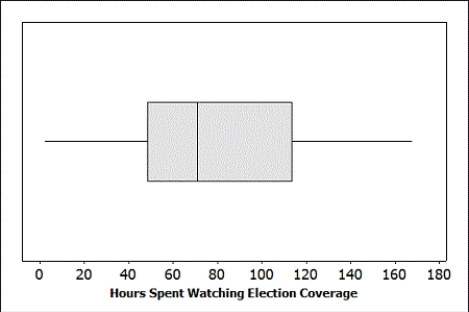
-Is it reasonable to use the t-distribution to construct a confidence interval for the average amount of time spent watching election coverage by U.S. adults? Explain briefly.
Correct Answer:

Verified
Yes. We have a moderate sample...View Answer
Unlock this answer now
Get Access to more Verified Answers free of charge
Correct Answer:
Verified
View Answer
Unlock this answer now
Get Access to more Verified Answers free of charge
Q136: Use the following<br>Consider taking random samples of
Q137: Use the following<br>A dotplot and the summary
Q138: Use the following <br>A sample of 148
Q139: Use the following <br>A certain species of
Q140: Use the following <br>Consider constructing a 90%
Q142: Use the following <br>Situations comparing two proportions
Q143: Use the following<br>Students in a large lecture
Q144: Use the following<br>In an October 2012 survey
Q145: Use the following<br>In an October 2012 survey
Q146: Use the following <br>An Internet provider contacts