Essay
Use the following
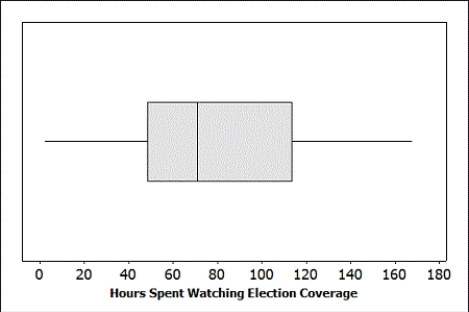
November 6, 2012 was election day. Many of the major television networks aired coverage of the incoming election results during the primetime hours. The provided boxplot displays the amount of time (in minutes) spent watching election coverage for a random sample of 25 U.S. adults. In this sample, the average time spent watching election coverage was 80.44 minutes with standard deviation of 43.99 minutes.
-What sample size would we need to estimate the average amount of time U.S. adults watching election coverage with 99% confidence and a margin of error of  5 hours?
Correct Answer:

Verified
 = 513.24
...View Answer
Unlock this answer now
Get Access to more Verified Answers free of charge
Correct Answer:
Verified
...
View Answer
Unlock this answer now
Get Access to more Verified Answers free of charge
Q10: Use the following <br>For each of the
Q11: Use the following <br>Consider taking random samples
Q12: Use the following<br>Zumba, often described as a
Q13: Use the following <br>Admissions records at a
Q14: Use the following <br>"Black Friday,"<br>which occurs annually
Q16: Use the following <br>Situations comparing two proportions
Q17: Use the following <br>A 1997 study described
Q18: Use the following <br>In May 2012 President
Q19: Use the following<br>November 6, 2012 was election
Q20: Use the following <br>A random sample of