Multiple Choice
The following figure shows a randomization distribution for the hypotheses  versus
 . The statistic used for each sample is
  . Which of the two possible sample results provides the most evidence against Ho?
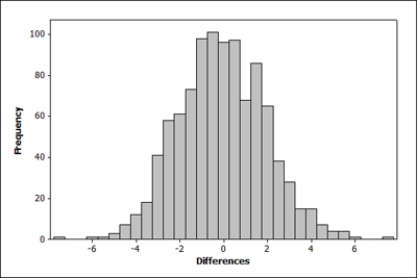
A) 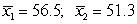
B) 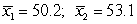
Correct Answer:

Verified
Correct Answer:
Verified
Related Questions
Q1: Use the following <br>A certain species of
Q2: Use the following <br>As of August 8,
Q3: Use the following <br>A Division III college
Q4: Use the following <br>A Division III college
Q6: Use the following <br>Consider testing the hypotheses
Q7: Use the following<br>The makers of a popular
Q8: When generating a randomization sample, the sample
Q9: Suppose that a 95% confidence interval for
Q10: Use the following <br>The owner of a
Q11: Use the following<br>A Division III college men's