Essay
The provided histogram displays the prices (in thousands of dollars) of 17 homes sold between November 2011 and February 2012 in a Midwestern city.
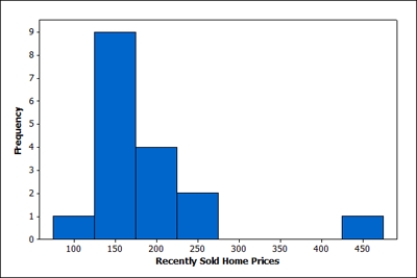
In general this shape, right skewed with some unusually high values, is common for describing home values in many cities. For this reason, the median home value for a city is a useful parameter. This sample of recently sold homes had a median price (value) of $166,500. Someone considering moving to this city is interested in knowing if the median home value is more than $150,000.
Describe how you would generate a single randomization sample in this situation, and identify the statistic you would calculate from the sample.
Correct Answer:

Verified
The current sample first needs to be shi...View Answer
Unlock this answer now
Get Access to more Verified Answers free of charge
Correct Answer:
Verified
View Answer
Unlock this answer now
Get Access to more Verified Answers free of charge
Q58: Use the following <br>A study recently described
Q59: Use the following <br>The owner of a
Q60: Use the following<br>A student in an introductory
Q61: Use the following <br>As of August 8,
Q62: Use the following<br>The owner of a small
Q64: In August 2012 Gallup reported the results
Q65: Use the following <br>There are 24 students
Q66: Use the following <br>A certain species of
Q67: Use the following<br>A certain species of tree
Q68: Use the following<br>There are 24 students enrolled