Essay
The following table is associated with the average number of patients served,
0ver 6 days, at different months of the year.
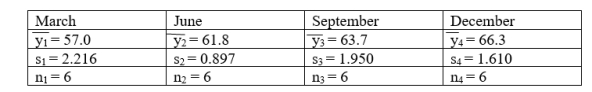
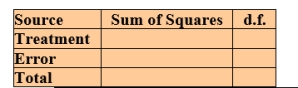
 Present the ANOVA table for these data.
Correct Answer:

Verified
Correct Answer:
Verified
Q5: Consider the following data:<br> <img src="https://d2lvgg3v3hfg70.cloudfront.net/TB10841/.jpg" alt="Consider
Q6: Taking <span class="ql-formula" data-value="\alpha"><span class="katex"><span
Q7: 16 Three processes for creating flame-retardant fabric
Q8: Consider the following data:<br> <img src="https://d2lvgg3v3hfg70.cloudfront.net/TB10841/.jpg" alt="Consider
Q9: There are four lecture sessions for a
Q11: Four drug stores have a pharmacy which
Q12: Consider the following ANOVA table with treatment
Q13: Consider the following data: <br> <img src="https://d2lvgg3v3hfg70.cloudfront.net/TB10841/.jpg"
Q14: Perfect scores are not always attained in
Q15: Use the relations for sums of squares