Essay
Consider the data set
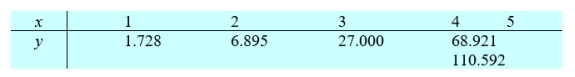
A) Obtain the best fitting straight line with 
B) What proportion of the y'variability is explained by the fitted line?
Round your answers to three decimal places.
Correct Answer:

Verified
Correct Answer:
Verified
Related Questions