Essay
A survey was conducted to study the degree of satisfaction with the service of passengers from New York City to Washington D.C. The following table shows the relative frequencies.
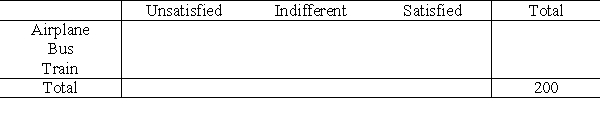
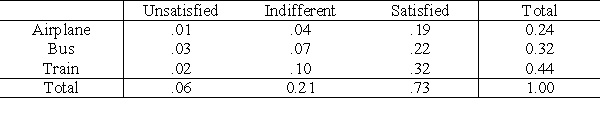 Complete the table of cross-tabulated frequencies.
Correct Answer:

Verified
Correct Answer:
Verified
Related Questions
Q5: Observations on two or more variables recorded
Q6: Final grades of students enrolled in an
Q7: In a group of 280 college students,
Q8: The false correlation produced by a lurking
Q9: Final grades of students enrolled in a
Q11: The value of the correlation coefficient r,
Q12: The total frequency for any row is
Q13: In an experiment to study the relation
Q14: In statistical terminology, contingency tables correspond to
Q15: In the following instance, would you expect