Short Answer
The following table shows the countries whose teams have won the UEFA Champions League.

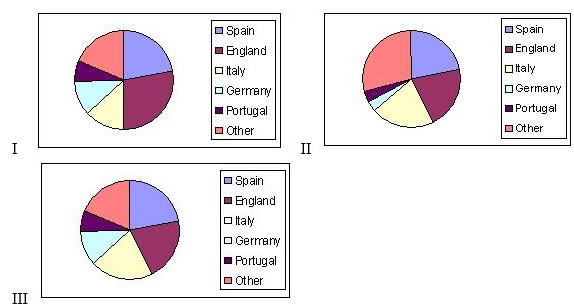
a) Calculate the relative frequency of each country. Round your answers to three decimal places
b) Select the pie chart that better describes the data.
Correct Answer:

Verified
Correct Answer:
Verified
Q18: Calculate the mean and median of the
Q19: In describing a data set of measurements,
Q20: The second quartile of a data set
Q21: A die is rolled 16 times, the
Q22: According to the empirical guidelines for symmetric
Q24: The stem-and-leaf display given here shows
Q25: Based on the boxplot,<br> <img src="https://d2lvgg3v3hfg70.cloudfront.net/TB10841/.jpg" alt="Based
Q26: Calculate the mean and the median of
Q27: Let s<sub>1</sub>, s<sub>2</sub>, and s<sub>3</sub> be the
Q28: Since the median is not affected by