Short Answer
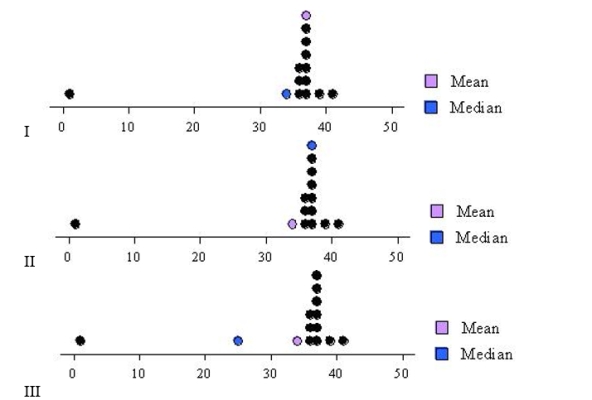
In a period of twelve years, the record low temperatures ( F) in Los Angeles CA were:
 Find the dot diagram that corresponds to these data.
Correct Answer:

Verified
Correct Answer:
Verified
Q25: Based on the boxplot,<br> <img src="https://d2lvgg3v3hfg70.cloudfront.net/TB10841/.jpg" alt="Based
Q26: Calculate the mean and the median of
Q27: Let s<sub>1</sub>, s<sub>2</sub>, and s<sub>3</sub> be the
Q28: Since the median is not affected by
Q29: For the data set<br> <img src="https://d2lvgg3v3hfg70.cloudfront.net/TB10841/.jpg" alt="For
Q31: For the data set<br> <img src="https://d2lvgg3v3hfg70.cloudfront.net/TB10841/.jpg" alt="For
Q32: The number of touchdowns of a college
Q33: A die is rolled 16 times, the
Q34: Calculate the quartiles of the following data
Q35: Use the stem-and-leaf display to construct a