Multiple Choice
Atmospheric carbon dioxide levels are shown below.This graph was developed by measurements that were obtained by 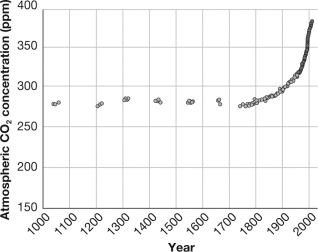
A) direct measurements on Mauna Loa,Hawaii,and from air bubbles trapped in ice.
B) studies of the tissues of plants and their structures in response to differing CO₂ levels.
C) carbon isotope levels in sea floor sediments.
D) measurements from undisturbed bat droppings in caves on a South Pacific island.
Correct Answer:

Verified
Correct Answer:
Verified
Q8: Describe how burning fossil fuels can warm
Q11: In comparison to past estimates, extinction rates
Q14: Which of the following is NOT a
Q16: Which of the following would best be
Q20: Describe how a decrease in plant populations
Q34: Which of the following activities would have
Q36: What best describes the relationship between cutting
Q40: The hydrologic cycle includes<br>A)biotic factors only.<br>B)abiotic factors
Q48: Climate change increases fires in the rainforest.This
Q73: Match the term to the correct example.<br>-a