Multiple Choice
This graph shows which of the following? 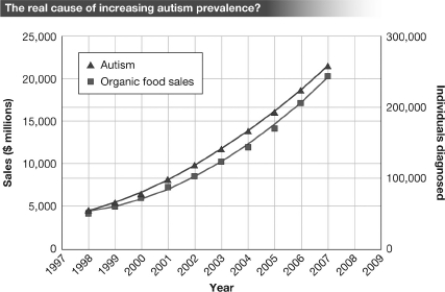
A) There is a positive correlation between the sale/consumption of organic food and the number of individuals diagnosed with autism between 1998 and 2007.
B) The increased consumption of organic food has led to an increase in the rate of autism between 1998 and 2007.
C) Consuming organic food causes autism.
D) There is positive evidence that a cause-and-effect relationship exists between the consumption of organic food and the development of autism.
Correct Answer:

Verified
Correct Answer:
Verified
Q4: The federally funded Centers for Disease Control
Q22: Developing a scientific understanding of a natural
Q37: Although it seems contradictory,real science does not
Q46: Evaluate the following and determine whether or
Q47: Based on the scientific evidence presented in
Q62: Which of the following texts are examples
Q70: Which of the following texts are examples
Q71: Announcing "scientific" findings in a press conference
Q84: Which of the following texts are examples
Q90: Peer-reviewed scientific journals,technical reports,conference proceedings,and dissertations are