Multiple Choice
Figure 3.8
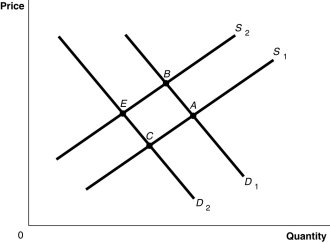
-Refer to Figure 3.8.The graph in this figure illustrates an initial competitive equilibrium in the market for apples at the intersection of D₁ and S₁ (point A) . If worms eat half the apple crop how will the market equilibrium point change?
A) The equilibrium point will move from A to B.
B) The equilibrium point will move from A to C.
C) There will be no change in the equilibrium point.
D) The equilibrium point will move from A to E.
Correct Answer:

Verified
Correct Answer:
Verified
Q37: Table 3.1 <img src="https://d2lvgg3v3hfg70.cloudfront.net/TB3061/.jpg" alt="Table 3.1
Q42: At a product's equilibrium price<br>A)the product's demand
Q44: In June, buyers of titanium expect that
Q82: Figure 3.1<br> <img src="https://d2lvgg3v3hfg70.cloudfront.net/TB4178/.jpg" alt="Figure 3.1
Q90: Table 3-2<br> <img src="https://d2lvgg3v3hfg70.cloudfront.net/TB2849/.jpg" alt="Table 3-2
Q92: Table 3.3<br> <span class="ql-formula" data-value="\begin{array}{|l|c|}\hline
Q117: Figure 3-1 <img src="https://d2lvgg3v3hfg70.cloudfront.net/TB4188/.jpg" alt="Figure 3-1
Q157: Assume there is a shortage in the
Q207: The income effect explains why there is
Q461: Let D = demand, S = supply,