Multiple Choice
Figure 6-6 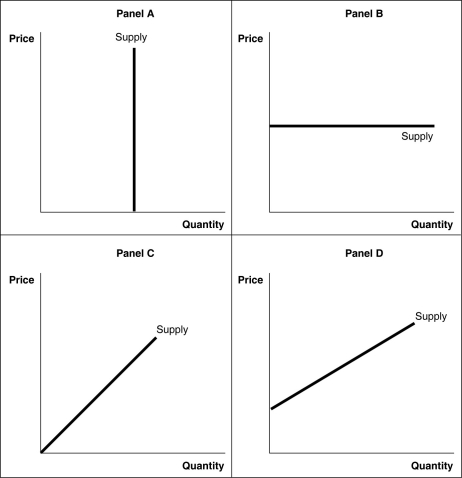
-Refer to Figure 6-6.The supply curve on which price elasticity changes at every point is shown in
A) Panel A.
B) Panel B.
C) Panel C.
D) Panel D.
Correct Answer:

Verified
Correct Answer:
Verified
Q53: Demand for staples such as dairy products
Q56: For consumers who opt to pay a
Q72: Figure 6-7 <img src="https://d2lvgg3v3hfg70.cloudfront.net/TB4184/.jpg" alt="Figure 6-7
Q125: If you expect the economy is going
Q138: Figure 6-4<br> <img src="https://d2lvgg3v3hfg70.cloudfront.net/TB4193/.jpg" alt="Figure 6-4
Q145: According to an article in the Wall
Q172: If the market for a product is
Q236: If a firm lowered the price of
Q276: Figure 6-1<br> <img src="https://d2lvgg3v3hfg70.cloudfront.net/TB4193/.jpg" alt="Figure 6-1
Q285: A demand curve that is horizontal indicates