Multiple Choice
Figure 13.2
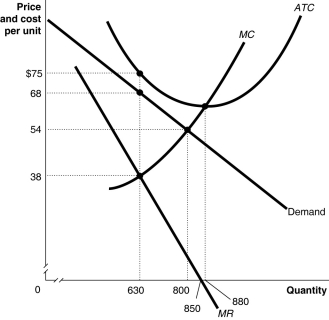
Figure 13.2 above shows the demand and cost curves facing a monopolist.
-Refer to Figure 13.2.Suppose the monopolist represented in the diagram above produces positive output.What is the price charged at the profit-maximizing/loss-minimizing output level?
A) $38
B) $54
C) $68
D) $75
Correct Answer:

Verified
Correct Answer:
Verified
Q17: Suppose that a perfectly competitive industry becomes
Q24: The _ is the law that covers
Q25: If a natural monopoly regulatory board sets
Q26: The Competition Bureau will prevent a merger
Q27: Consider the following characteristics:<br>a)a market structure with
Q30: A Canadian government patent lasts<br>A)forever.<br>B)50 years.<br>C)20 years.<br>D)7
Q34: Table 13.2<br> <span class="ql-formula" data-value="\begin{array}{|c|c|c|}\hline
Q103: Which one of the following about a
Q131: Peet's Coffee and Teas produces some flavourful
Q154: A monopoly is characterized by all of