Multiple Choice
Figure 13.2
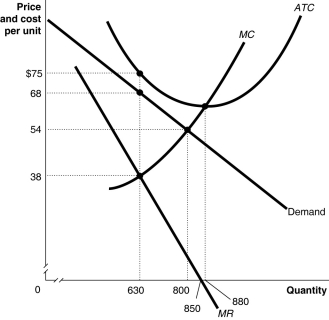
Figure 13.2 above shows the demand and cost curves facing a monopolist.
-Refer to Figure 13.2.What happens to the monopolist represented in the diagram in the long run?
A) It will raise its price at least until it breaks even.
B) If the cost and demand curves remain the same, it will exit the market.
C) The government will subsidize the monopoly to enable it to break even.
D) It will be forced out of business by more efficient producers.
Correct Answer:

Verified
Correct Answer:
Verified
Q12: In the short run, even if a
Q62: What is a monopoly? Can a firm
Q63: The De Beers Company, one of the
Q107: To maintain a monopoly, a firm must
Q115: Figure 13.3<br> <img src="https://d2lvgg3v3hfg70.cloudfront.net/TB4178/.jpg" alt="Figure 13.3
Q140: What is the relationship between marginal revenue
Q169: Governments grant patents to<br>A)compensate firms for research
Q192: A natural monopoly is characterized by large
Q256: If a theatre company expects $250,000 in
Q279: If we use a narrow definition of