Multiple Choice
Figure 13.3
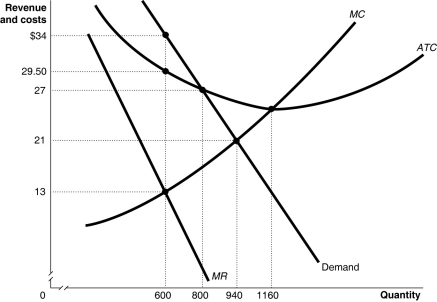
Figure 13.3 shows the demand and cost curves for a monopolist.
-Refer to Figure 13.3.What is the profit-maximizing/loss-minimizing output level?
A) 600 units
B) 800 units
C) 940 units
D) 1,160 units
Correct Answer:

Verified
Correct Answer:
Verified
Q12: In the short run, even if a
Q61: a.What is the difference between a horizontal
Q63: The De Beers Company, one of the
Q115: Figure 13.3<br> <img src="https://d2lvgg3v3hfg70.cloudfront.net/TB4178/.jpg" alt="Figure 13.3
Q119: Antitrust laws are intended to<br>A)reduce trust the
Q120: Figure 13.9<br> <img src="https://d2lvgg3v3hfg70.cloudfront.net/TB4178/.jpg" alt="Figure 13.9
Q169: Governments grant patents to<br>A)compensate firms for research
Q192: A natural monopoly is characterized by large
Q216: If a monopolist's marginal revenue is $15
Q246: A product's price approaches its marginal cost