Multiple Choice
Figure 13.3
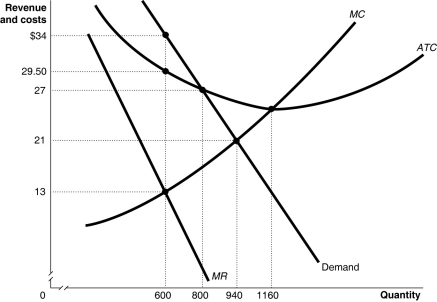
Figure 13.3 shows the demand and cost curves for a monopolist.
-Refer to Figure 13.3.What is the amount of the monopoly's total cost of production?
A) $21,600
B) $17,700
C) $9,340
D) $7,800
Correct Answer:

Verified
Correct Answer:
Verified
Q34: Table 13.2<br> <span class="ql-formula" data-value="\begin{array}{|c|c|c|}\hline
Q38: Table 13.1<br> <span class="ql-formula" data-value="\begin{array}{|c|c|c|}\hline
Q40: In Hamilton, Ontario there are three very
Q42: Table 13.1<br> <span class="ql-formula" data-value="\begin{array}{|c|c|c|}\hline
Q103: Which one of the following about a
Q133: To maximize profit, a monopolist will produce
Q143: If a per-unit tax on output sold
Q154: A monopoly is characterized by all of
Q193: What is a network externality?<br>A)It refers to
Q201: Joe Santos owns the only pizza parlor