Multiple Choice
Figure 13.5
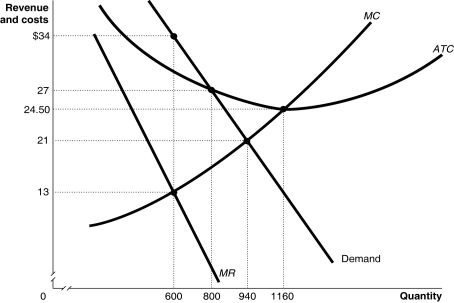
Figure 13.5 shows the demand and cost curves for a monopolist.
-Refer to Figure 13.5.What is the difference between the monopoly's price and perfectly competitive industry's price?
A) The monopoly's price is higher by $9.50.
B) The monopoly's price is higher by $13.
C) The monopoly's price is higher by $3.50.
D) The monopoly's price is higher by $21.
Correct Answer:

Verified
Correct Answer:
Verified
Q11: If an increase in the price of
Q13: Figure 13.5<br> <img src="https://d2lvgg3v3hfg70.cloudfront.net/TB4178/.jpg" alt="Figure 13.5
Q15: Why would some firms collude in violation
Q17: An example of a monopoly based on
Q18: Table 13.2<br> <span class="ql-formula" data-value="\begin{array}{|c|c|c|}\hline
Q19: What happens to a monopoly's revenue when
Q19: The International Nickel Company of Canada had
Q95: The Ecke's family virtual monopoly on commercial
Q158: A possible advantage of a horizontal merger
Q167: If a monopolist's price is $50 per