Multiple Choice
Figure 13.9
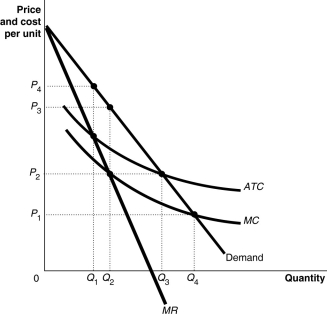
Figure 13.9 shows the cost and demand curves for the Erickson Power Company.
-Refer to Figure 13.9.The profit-maximizing price is
A) P₁.
B) P₂.
C) P₃.
D) P₄.
Correct Answer:

Verified
Correct Answer:
Verified
Related Questions
Q15: When a proposed merger between two companies
Q40: In Hamilton, Ontario there are three very
Q42: Table 13.1<br> <span class="ql-formula" data-value="\begin{array}{|c|c|c|}\hline
Q48: Table 13.2<br> <span class="ql-formula" data-value="\begin{array}{|c|c|c|}\hline
Q96: Which of the following is a characteristic
Q133: To maximize profit, a monopolist will produce
Q143: If a per-unit tax on output sold
Q156: For a natural monopoly, the marginal cost
Q211: Which of the following statements applies to
Q266: Firms do not have market power in