Multiple Choice
Figure 13.9
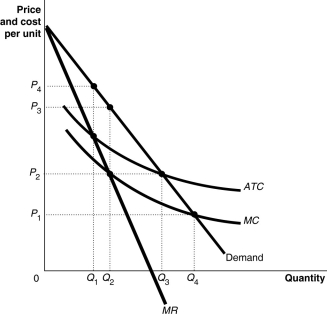
Figure 13.9 shows the cost and demand curves for the Erickson Power Company.
-Refer to Figure 13.9.If the government regulates Erickson Power Company so that the firm can earn a normal profit, the price would be set at ________ and the output level is ________.
A) P₁; Q₄
B) P₂; Q₃
C) P₂; Q₂
D) P₃; Q₂
Correct Answer:

Verified
Correct Answer:
Verified
Q4: Table 13.1<br> <span class="ql-formula" data-value="\begin{array}{|c|c|c|}\hline
Q11: If an increase in the price of
Q13: Figure 13.5<br> <img src="https://d2lvgg3v3hfg70.cloudfront.net/TB4178/.jpg" alt="Figure 13.5
Q19: What happens to a monopoly's revenue when
Q53: In a natural monopoly, throughout the range
Q78: If a firm's average total cost is
Q106: A patent or copyright is a barrier
Q158: A possible advantage of a horizontal merger
Q167: If a monopolist's price is $50 per
Q209: Relative to a perfectly competitive market, a