Multiple Choice
Figure 13.9
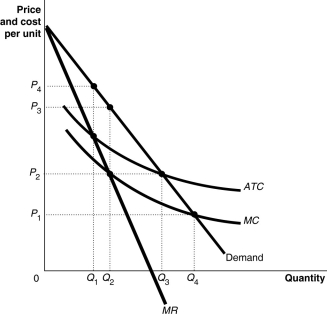
Figure 13.9 shows the cost and demand curves for the Erickson Power Company.
-Refer to Figure 13.9.What is the economically efficient output level and what is the price at that level?
A) Q₄; P₁
B) Q₃; P₂
C) Q₂; P₂
D) Q₂; P₃
Correct Answer:

Verified
Correct Answer:
Verified
Q10: The demand curve for the monopoly's product
Q65: Suppose a monopoly is producing its profit-maximizing
Q126: A local or provincial electrical company has
Q127: Tickets to Toronto Maple Leafs games regularly
Q129: Many natural monopolies in Canada are regulated
Q133: Figure 13.6<br> <img src="https://d2lvgg3v3hfg70.cloudfront.net/TB4178/.jpg" alt="Figure 13.6
Q135: Figure 13.1<br> <img src="https://d2lvgg3v3hfg70.cloudfront.net/TB4178/.jpg" alt="Figure 13.1
Q138: How do the price and quantity of
Q150: A market economy benefits from market power<br>A)if
Q250: Provide two examples of a government barrier