Multiple Choice
Figure 15.1
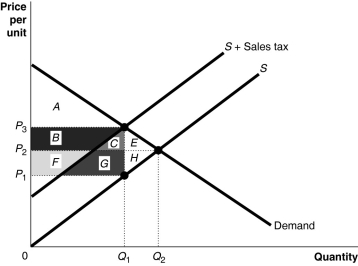
-Refer to Figure 15.1.Of the tax revenue collected by the government, the portion borne by producers is represented by the area
A) B + C.
B) F + G.
C) E + H.
D) B + C + F + G.
Correct Answer:

Verified
Correct Answer:
Verified
Q30: Rapid economic growth tends to increase the
Q69: If the marginal tax rate is less
Q92: Figure 15.2<br> <img src="https://d2lvgg3v3hfg70.cloudfront.net/TB4178/.jpg" alt="Figure 15.2
Q93: Table 15.3<br> <span class="ql-formula" data-value="\begin{array}{|c|r|}\hline
Q100: Figure 15.5<br> <img src="https://d2lvgg3v3hfg70.cloudfront.net/TB4178/.jpg" alt="Figure 15.5
Q102: Suppose the equilibrium price and quantity of
Q192: A statistical tool used to measure inequality
Q215: The federal corporate income tax is<br>A)regressive.<br>B)proportional.<br>C)progressive.<br>D)unfair.
Q235: If you pay $2,000 in taxes on
Q257: Figure 18-4<br> <img src="https://d2lvgg3v3hfg70.cloudfront.net/TB4193/.jpg" alt="Figure 18-4