Multiple Choice
Figure 15.2
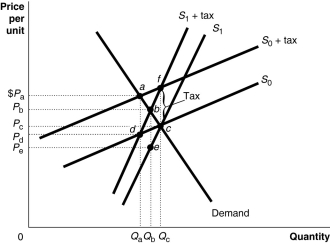
Figure 15.2 shows a demand curve and two sets of supply curves, one set more elastic than the other.
-Refer to Figure 15.2.If the government imposes an excise tax of $1.00 on every unit sold,
A) the deadweight loss is identical under either supply curve.
B) the deadweight loss is greater under the supply curve S₁.
C) the deadweight loss is greater under the supply curve S₀.
D) there is no deadweight loss since revenue raised is used to fund government projects.
Correct Answer:

Verified
Correct Answer:
Verified
Q28: The "ability-to-pay" principle of taxation is the
Q103: What is the low income cut-off?<br>A)It is
Q111: Local governments in Canada receive most of
Q120: The government of Silverado raises revenue to
Q128: If you pay $2,000 in taxes on
Q138: If the government wants to minimize the
Q162: Rational ignorance<br>A)explains why consumers ignore sunk costs
Q193: Explain the effect of price elasticities of
Q198: The median voter model implies that<br>A)many people
Q252: Exempting food purchases from sales tax is