Multiple Choice
Figure 15.5
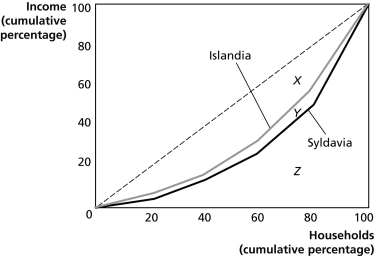
Figure 15.5 shows the Lorenz curves for Islandia and Syldavia.
-Refer to Figure 15.5.If area X = 2,060, area Y = 240, and area Z = 2,700, calculate the Gini coefficient for Islandia.
A) 0.41
B) 0.45
C) 0.70
D) 0.76
Correct Answer:

Verified
Correct Answer:
Verified
Q19: Figure 15.4<br> <img src="https://d2lvgg3v3hfg70.cloudfront.net/TB4178/.jpg" alt="Figure 15.4
Q20: An example of an excise tax in
Q22: One argument advanced in favour of reducing
Q26: Logrolling may result in<br>A)legislation that yields economy-wide
Q27: Figure 15.1<br> <img src="https://d2lvgg3v3hfg70.cloudfront.net/TB4178/.jpg" alt="Figure 15.1
Q60: If the marginal tax rate is equal
Q98: If the marginal tax rate is greater
Q101: If you pay a constant percentage of
Q144: What is logrolling?<br>A)a situation where a policymaker
Q165: Describe each of the principles governments consider