Short Answer
Refer to the figure below, and then answer the question that follows.
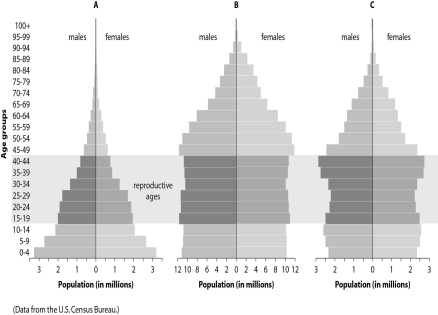
-Which graph,A,B,or C,represents a population likely to exhibit the greatest population rate increase over the next few decades?
Correct Answer:

Verified
Correct Answer:
Verified
Related Questions
Q11: The carrying capacity of an environment can
Q12: What factors may affect the carrying capacity
Q13: Studying the amount of carbon stored in
Q14: Which of the following species would be
Q15: Which is true of predictions about the
Q17: Species with individuals that die equally or
Q18: Which of the following would be generally
Q19: Which of the following would be a
Q20: Most K-selected species have short generation times.
Q21: Match the following.