Multiple Choice
Figure 3-8
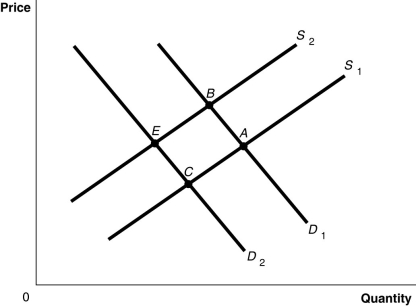
-Refer to Figure 3-8.The graph in this figure illustrates an initial competitive equilibrium in the market for motorcycles at the intersection of D₁ and S₁ (point A) If there is a surplus of motorcycles how will the equilibrium point change?
A) The equilibrium point will move from A to B.
B) The equilibrium point will move from A to C.
C) There will be no change in the equilibrium point.
D) The equilibrium point will move from A to E.
Correct Answer:

Verified
Correct Answer:
Verified
Q54: All else equal,as the price of a
Q100: Suppose consumer preference for organic corn starts
Q133: An inferior good is a good for
Q155: Figure 3-4<br> <img src="https://d2lvgg3v3hfg70.cloudfront.net/TB4193/.jpg" alt="Figure 3-4
Q163: Let D = demand,S = supply,P =
Q166: Figure 3-5 <img src="https://d2lvgg3v3hfg70.cloudfront.net/TB1236/.jpg" alt="Figure 3-5
Q174: Explain how it would be possible for
Q179: A normal good is a good for
Q186: Figure 3-6 <img src="https://d2lvgg3v3hfg70.cloudfront.net/TB1236/.jpg" alt="Figure 3-6
Q217: Assume that the price for lawn care