Multiple Choice
Figure 15-3
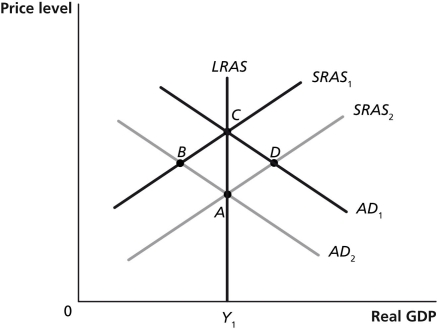
-Refer to Figure 15-3.Which of the points in the above graph are possible long-run equilibria?
A) A and B
B) A and C
C) A and D
D) B and D
Correct Answer:

Verified
Correct Answer:
Verified
Related Questions
Q36: Using the aggregate supply and demand model,illustrate
Q38: In the dynamic aggregate demand and aggregate
Q74: The real business cycle model focuses on
Q94: If workers and firms have rational expectations,they
Q146: Inflation is generally the result of total
Q158: What is the relationship among the AD,SRAS
Q171: Long-run macroeconomic equilibrium occurs when the aggregate
Q178: According to the "wealth effect," when the
Q180: Full-employment GDP is also known as<br>A)realized GDP.<br>B)potential
Q181: Explain how the economy moves back to