Multiple Choice
Figure 15-3
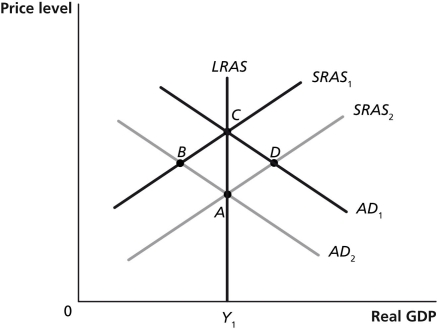
-Refer to Figure 15-3.Which of the points in the above graph are possible short-run equilibria but not long-run equilibria? Assume that Y₁ represents potential GDP.
A) A and B
B) A and C
C) C and D
D) B and D
Correct Answer:

Verified
Correct Answer:
Verified
Q41: If potential GDP is equal to $600
Q51: A decrease in the price level results
Q108: If the short-run aggregate supply increases by
Q120: Figure 15-1<br> <img src="https://d2lvgg3v3hfg70.cloudfront.net/TB6608/.jpg" alt="Figure 15-1
Q128: Figure 15-2<br> <img src="https://d2lvgg3v3hfg70.cloudfront.net/TB6608/.jpg" alt="Figure 15-2
Q139: Explain how the static aggregate demand and
Q141: Article Summary<br>For reasons including overproduction in the
Q190: Proponents of the real business cycle model
Q217: Monetarists believe that the quantity of money
Q278: According to the real business cycle model<br>A)increases