Multiple Choice
Figure 15-4
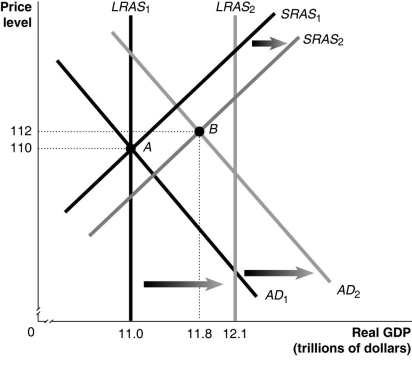
-Refer to Figure 15-4.In the figure above,LRAS₁ and SRAS₁ denote LRAS and SRAS in year 1,while LRAS₂ and SRAS₂ denote LRAS and SRAS in year 2.Given the economy is at point A in year 1,what is the growth rate in potential GDP in year 2?
A) 8%
B) 9.1%
C) 10%
D) 12%
Correct Answer:

Verified
Correct Answer:
Verified
Q16: Potential GDP is also referred to as<br>A)realized
Q31: While in office,President Obama discussed raising income
Q119: Using an aggregate demand graph,illustrate the impact
Q149: The short-run aggregate supply curve has a<br>A)negative
Q172: For the recession of 2007-2009,it took _
Q173: Figure 15-1<br> <img src="https://d2lvgg3v3hfg70.cloudfront.net/TB6608/.jpg" alt="Figure 15-1
Q175: The "interest rate effect" can be described
Q181: Figure 15-2<br> <img src="https://d2lvgg3v3hfg70.cloudfront.net/TB6608/.jpg" alt="Figure 15-2
Q197: Most recessions in the United States since
Q232: On the long-run aggregate supply curve<br>A)an increase