Multiple Choice
Figure 15-4
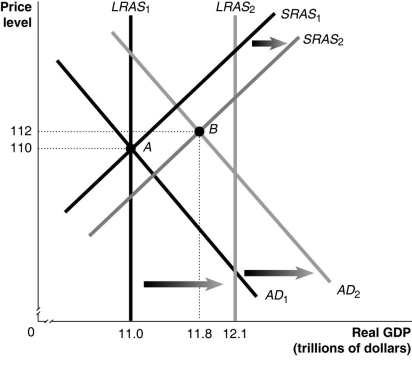
-Refer to Figure 15-4.Given the economy is at point A in year 1,what is the inflation rate between year 1 and year 2?
A) 0.9%
B) 1.8%
C) 2.7%
D) 3.0%
Correct Answer:

Verified
Correct Answer:
Verified
Q51: Figure 15-1<br> <img src="https://d2lvgg3v3hfg70.cloudfront.net/TB6608/.jpg" alt="Figure 15-1
Q55: Figure 15-3<br> <img src="https://d2lvgg3v3hfg70.cloudfront.net/TB6608/.jpg" alt="Figure 15-3
Q57: Figure 15-1<br> <img src="https://d2lvgg3v3hfg70.cloudfront.net/TB6608/.jpg" alt="Figure 15-1
Q92: Explain how each of the following events
Q95: The level of long-run aggregate supply is
Q124: Workers and firms both expect that prices
Q130: The invention of the integrated circuit by
Q156: When people became _ concerned with the
Q223: Potential GDP refers to the level of<br>A)real
Q249: Suppose the U.S.GDP growth rate is slower