Multiple Choice
Figure 15-4
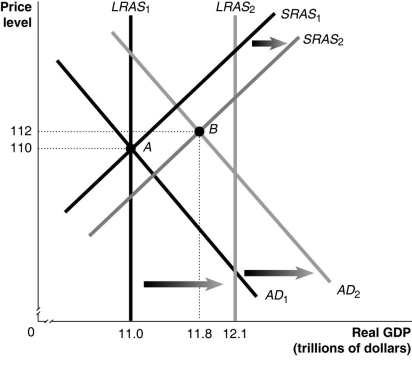
-Refer to Figure 15-4.In the figure above,AD₁,LRAS₁ and SRAS₁ denote AD,LRAS and SRAS in year 1,while AD₂,LRAS₂ and SRAS₂ denote AD,LRAS and SRAS in year 2.Given the economy is at point A in year 1,what is the actual growth rate in GDP in year 2?
A) 2.5%
B) 7.3%
C) 8.0%
D) 10.0%
Correct Answer:

Verified
Correct Answer:
Verified
Q11: A decrease in government spending will result
Q70: The basic aggregate demand and aggregate supply
Q78: An increase in the price level causes
Q106: Suppose the economy is at full employment
Q132: Use the dynamic model of aggregate demand
Q137: The long-run adjustment to a negative supply
Q194: The process of an economy adjusting from
Q250: German luxury car exports were hurt in
Q252: Suppose the economy is in long-run equilibrium
Q272: How do changes in income tax policies