Multiple Choice
Figure 15-4
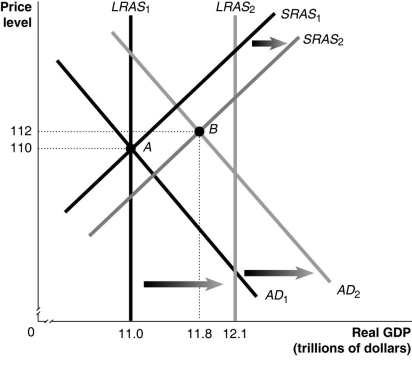
-Refer to Figure 15-4.Given the economy is at point A in year 1,what is the difference between the actual growth rate in GDP in year 2 and the potential growth rate in GDP in year 2?
A) 0.3%
B) 1.1%
C) 2.7%
D) 3.7%
Correct Answer:

Verified
Correct Answer:
Verified
Q6: Because of the slope of the aggregate
Q65: Figure 15-1<br> <img src="https://d2lvgg3v3hfg70.cloudfront.net/TB6608/.jpg" alt="Figure 15-1
Q66: Figure 15-3<br> <img src="https://d2lvgg3v3hfg70.cloudfront.net/TB6608/.jpg" alt="Figure 15-3
Q71: Figure 15-2<br> <img src="https://d2lvgg3v3hfg70.cloudfront.net/TB6608/.jpg" alt="Figure 15-2
Q102: Which of the following models relies on
Q111: President Trump has proposed lowering income taxes
Q138: Which of the following correctly describes the
Q196: Which of the following is one reason
Q200: Which of the following would cause the
Q216: Which of the following is an assumption