Multiple Choice
Figure 1.1
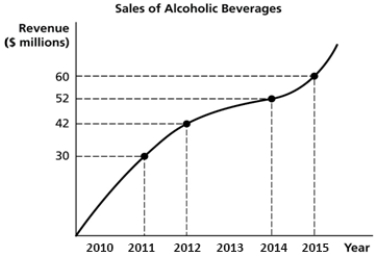
-Refer to Figure 1.1. Using the information in the figure above, calculate the percentage change in sales of alcoholic beverages between 2012 and 2015.
A) 23.1%
B) 23.8%
C) 30%
D) 42.9%
Correct Answer:

Verified
Correct Answer:
Verified
Related Questions
Q55: The basic economic problem of _ has
Q95: Which of the following is a microeconomics
Q110: Explain why economics is considered a social
Q147: Which of the following is not an
Q148: Soo Jin shares a one-bedroom apartment with
Q151: Mr Beasley chooses to invest in companies
Q152: An 'economic model' is a simplified version
Q153: What do economists assume about individuals?<br>A)That they
Q155: Abigail's Auto Art is a company that
Q206: In a centrally planned economy, the households