Essay
Use the following supply schedule for cherries to draw a graph of the supply curve. Be sure to label the supply curve and each axis, and show each point on the supply curve.
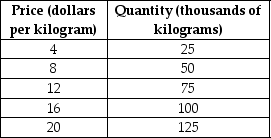
Correct Answer:

Verified
Correct Answer:
Verified
Related Questions
Q55: The equilibrium price will increase if the
Q57: If consumers expect that Apple will introduce
Q59: If consumers believe the price of LCD
Q61: Figure 3.6<br> <img src="https://d2lvgg3v3hfg70.cloudfront.net/TB3087/.jpg" alt="Figure 3.6
Q112: An increase in the price of off-road
Q137: A shortage is defined as the situation
Q171: Market equilibrium occurs where supply equals demand.
Q185: As the number of firms in a
Q222: In February, market analysts predict that the
Q238: Which of the following statements is true?<br>A)An