Essay
Table 3.1
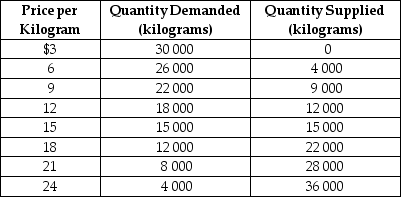
-Refer to Table 3.1. The table contains information about the corn market. Use the table to answer the following questions.
a.What are the equilibrium price and quantity of corn?
b.Suppose the prevailing price is $9 per kilogram. Is there a shortage or a surplus in the market?
c.What is the quantity of the shortage or surplus?
d.How many kilograms will be sold if the market price is $9 per kilogram?
e.If the market price is $9 per kilogram, what must happen to restore equilibrium in the market?
f.At what price will suppliers be able to sell 22 000 kilograms of corn?
g.Suppose the market price is $21 per kilogram. Is there a shortage or a surplus in the market?
h.What is the quantity of the shortage or surplus?
i.How many kilograms will be sold if the market price is $21 per kilogram?
j.If the market price is $21 per kilogram, what must happen to restore equilibrium in the market?
_____________________________________________________________________________________________
_____________________________________________________________________________________________
Correct Answer:

Verified
a. Equilibrium price = $15; Equilibrium ...View Answer
Unlock this answer now
Get Access to more Verified Answers free of charge
Correct Answer:
Verified
View Answer
Unlock this answer now
Get Access to more Verified Answers free of charge
Q7: The phrase "demand has decreased" means that<br>A)a
Q16: An increase in the price of inputs
Q41: Figure 3.8<br> <img src="https://d2lvgg3v3hfg70.cloudfront.net/TB3087/.jpg" alt="Figure 3.8
Q46: A 'supply schedule':<br>A)is a table that shows
Q47: Which of the following would shift the
Q50: Let D = demand, S = supply,
Q94: Explain the differences between a change in
Q146: What is the ceteris paribus condition?
Q153: The income effect of a price change
Q193: Figure 3-2<br> <img src="https://d2lvgg3v3hfg70.cloudfront.net/TB4193/.jpg" alt="Figure 3-2