Multiple Choice
Figure 3.8
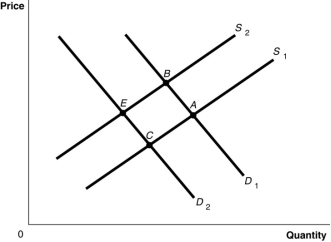
-Refer to Figure 3.8. The graph in this figure illustrates an initial competitive equilibrium in the market for apples at the intersection of D₁ and S₁ (point A) . If the price of oranges, a substitute for apples, decreases and the wages of apple workers increase, how will the equilibrium point change?
A) The equilibrium point will move from A to E.
B) The equilibrium point will move from A to B.
C) The equilibrium point will move from A to C.
D) The equilibrium will first move from A to B, then return to A.
Correct Answer:

Verified
Correct Answer:
Verified
Q5: Figure 3-2<br> <img src="https://d2lvgg3v3hfg70.cloudfront.net/TB4193/.jpg" alt="Figure 3-2
Q102: Suppose that when the price of hamburgers
Q104: 'Because corn chips and salsa are complements,
Q105: Assume that the demand curve for tablet
Q106: How would a decrease in the price
Q108: Assume that the demand curve for tablet
Q123: The _ effect refers to the change
Q124: Figure 3-6<br> <img src="https://d2lvgg3v3hfg70.cloudfront.net/TB4193/.jpg" alt="Figure 3-6
Q177: If in the market for peaches the
Q249: Let D = demand, S = supply,