Multiple Choice
Figure 3.8
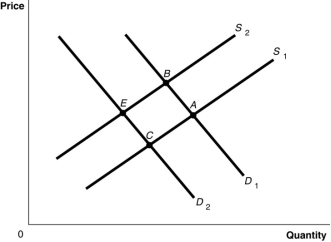
-Refer to Figure 3.8. The graph in this figure illustrates an initial competitive equilibrium in the market for sugar at the intersection of D₁ and S₂ (point B) . If there is a decrease in the price of fertiliser used on sugar cane and there is a decrease in tastes for sugar-sweetened soft drinks, how will the equilibrium point change?
A) The equilibrium point will move from B to A.
B) The equilibrium point will move from B to C.
C) There will be no change in the equilibrium point.
D) The equilibrium point will move from B to E.
Correct Answer:

Verified
Correct Answer:
Verified
Q8: Figure 3-4<br> <img src="https://d2lvgg3v3hfg70.cloudfront.net/TB4193/.jpg" alt="Figure 3-4
Q14: Figure 3-4<br> <img src="https://d2lvgg3v3hfg70.cloudfront.net/TB4192/.jpg" alt="Figure 3-4
Q110: Figure 3-7<br> <img src="https://d2lvgg3v3hfg70.cloudfront.net/TB4193/.jpg" alt="Figure 3-7
Q121: Figure 3.6<br> <img src="https://d2lvgg3v3hfg70.cloudfront.net/TB3087/.jpg" alt="Figure 3.6
Q127: Vineyards can grow either red wine grapes
Q128: Elle decreased her consumption of bananas when
Q129: Which of the following would cause both
Q194: The substitution effect explains why there is
Q199: Figure 3-2<br> <img src="https://d2lvgg3v3hfg70.cloudfront.net/TB4193/.jpg" alt="Figure 3-2
Q286: Figure 3-8 <img src="https://d2lvgg3v3hfg70.cloudfront.net/TB4188/.jpg" alt="Figure 3-8