Essay
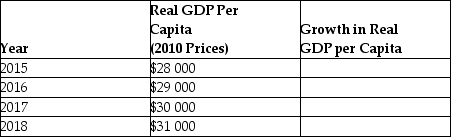
Use the following table to calculate the average annual growth rate in GDP. Also calculate the total percentage change in growth from 2015 to 2018. Explain the difference between the average annual growth rate in real per capita GDP from 2015 to 2018 and the total percentage change in growth from 2015 to 2018.
_____________________________________________________________________________________________
_____________________________________________________________________________________________
Correct Answer:

Verified
We calculate the average annual per cent...View Answer
Unlock this answer now
Get Access to more Verified Answers free of charge
Correct Answer:
Verified
View Answer
Unlock this answer now
Get Access to more Verified Answers free of charge
Q52: An example of foreign direct investment is
Q54: Which of the following countries was identified
Q55: Your friend owns an ice cream stand
Q56: Refer to Figure 6.1 for the following
Q58: According to 'new growth theory', the market
Q59: Which of the following is not an
Q60: What do economists call the small group
Q61: Which of the following is not a
Q62: Refer to Figure 6.1 for the following
Q102: Because knowledge capital is nonexcludable and nonrival,firms