Multiple Choice
Refer to Figure 6.1 for the following questions.
Figure 6.1
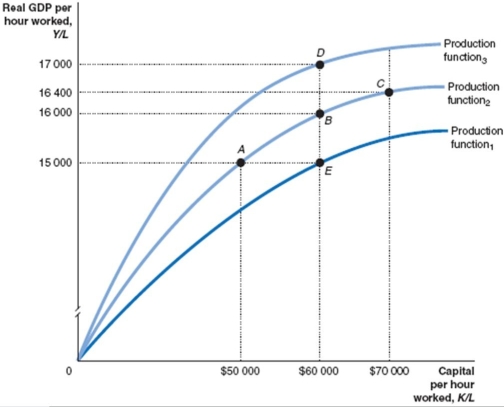
-Which of the following combination of points illustrates changes in the Soviet Union's economy from 1950-1980, as illustrated in Figure 6.1?
A) E to B
B) B to D
C) B to E
D) A to B to C
Correct Answer:

Verified
Correct Answer:
Verified
Q108: Calculate the GDP per capita for each
Q109: Empirical evidence from 1960-2012 shows that convergence
Q110: Which of the following policies is designed
Q111: Labour productivity can be explained by:<br>A)technological change
Q112: Starting at point E in the following
Q114: An example of foreign portfolio investment is?<br>A)the
Q115: What is the 'economic growth model'?<br>_<br>_
Q116: Because Australian labour markets are more controlled
Q118: List four types of government policies that
Q234: Foreign investment can give a low-income country<br>A)access