Multiple Choice
Suppose that the data in the following table reflects the prices in the economy. What is the inflation rate in between 2017 and 2018?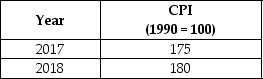
A) 5%
B) 2.9%
C) 4.6%
D) 7.5%
Correct Answer:

Verified
Correct Answer:
Verified
Related Questions
Q90: If the nominal interest rate is 8%
Q92: If inflation is higher than expected, in
Q93: When does 'inflation' occur?<br>A)when the value of
Q95: 'Anticipated inflation' increases the amount of taxation
Q96: Financial institutions who have loaned money at
Q97: There is a negative relationship between real
Q98: Which of the following is not a
Q99: 'Cost-push inflation' can be caused by:<br>A)insufficient demand
Q143: The nominal interest rate minus the inflation
Q253: The producer price index tracks the prices