Multiple Choice
Looking at the following table, what is the rate of growth of the average price level from 2016 to 2017?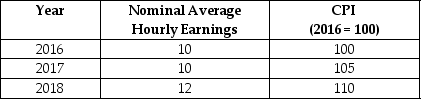
A) 1%
B) 2%
C) 3%
D) 5%
Correct Answer:

Verified
Correct Answer:
Verified
Related Questions
Q20: What is the difference between demand-pull inflation
Q61: The 'real rate' of interest is the:<br>A)nominal
Q62: When does 'deflation' occur?<br>A)When there is a
Q64: If nominal wages rise faster than the
Q65: Inflation redistributes income to a greater extent
Q67: Weekly expenditures for a family of four
Q69: Assume that between 2017 and 2018, the
Q70: An increase in real wages shifts the
Q197: If the CPI rises from 206.7 to
Q215: There are no costs to inflation if