Multiple Choice
Looking at the following table, what is the rate of growth of the average price level from 2016 to 2018?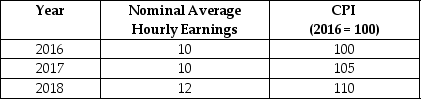
A) 1.52%
B) 2%
C) 3.5%
D) 4.76%
Correct Answer:

Verified
Correct Answer:
Verified
Related Questions
Q32: If the nominal rate of interest is
Q34: Looking at the following table, real wages
Q36: Which of the following statements is false?<br>A)Whether
Q38: Explain how lowering inflation acts like a
Q39: If nominal wages rise slower than the
Q40: In 1986, an Apple IIe computer with
Q41: Which of the following statements is true?<br>A)When
Q42: Consider a simple economy that produces only
Q58: Describe how inflation can be costly even
Q71: Explain why you would rather be a