Multiple Choice
Refer to Figure 10.2 for the following questions.
Figure 10.2
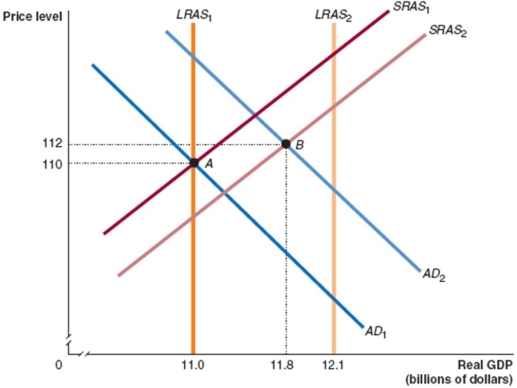
-In Figure 10.2, given the economy is at point A in year 1 and point B in year 2, what is the growth rate in real GDP between those two years?
A) 2.5%
B) 7.3%
C) 8.0%
D) 10.0%
Correct Answer:

Verified
Correct Answer:
Verified
Related Questions
Q83: Refer to Figure 10.1 for the following
Q84: New Keynesian macroeconomic theory emphasises the role
Q85: Briefly explain the schools of thought that
Q86: What are sticky prices or wages, and
Q87: Explain how each of the following events
Q89: When the price of oil rises unexpectedly,
Q90: Why does the short-run aggregate supply (SRAS)curve
Q91: The short-run aggregate supply curve has a
Q92: Which of the following is an assumption
Q93: Refer to Figure 10.1 for the following