Multiple Choice
Refer to Figure 10.2 for the following questions.
Figure 10.2
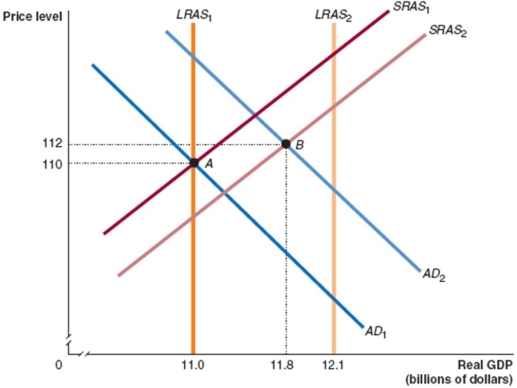
-In Figure 10.2, given the economy is at point A in year 1 and point B in year 2, what is the growth rate in potential GDP between those two years?
A) 9.1%
B) 8%
C) 12%
D) 10%
Correct Answer:

Verified
Correct Answer:
Verified
Related Questions
Q54: The wealth effect occurs when the price
Q55: The interest-rate effect is described as an
Q56: The wide-spread recessions of 2007-2009 caused a
Q57: If more workers leave Australia to seek
Q58: Suppose a developing country receives more machinery
Q61: What happens if technological change occurs in
Q62: Use the dynamic aggregate demand and aggregate
Q63: 'Monetarism' is a school of thought put
Q64: List and explain the three reasons the
Q138: Why is the long- run aggregate supply